
SpareRoom Rental Index
Average rents are updated every quarter. Last updated October 2026 with Q3 2026 rental index data.
UK room rents hit record highs as supply shrinks
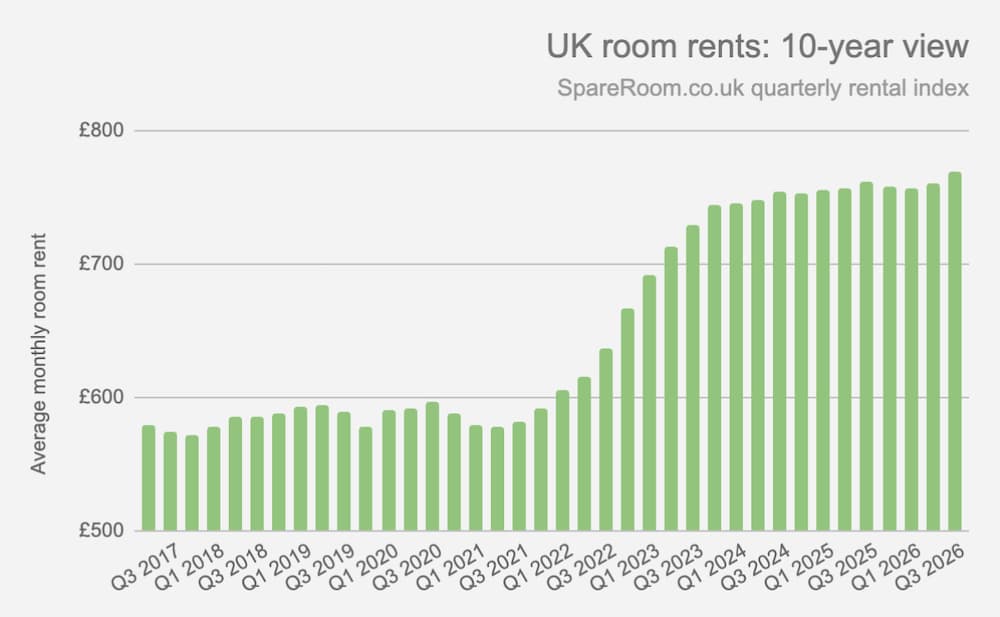
The average UK room rent has hit a new high of £769 per month. After the introduction of the Renters’ Rights Act in England in May, UK room rental supply fell -4.7% year on year in Q3.
Record regional highs
Rents have reached new highs in seven of the UK’s nine regions. South West England has seen the biggest year-on-year rent rise (+2.3%) and room rents have hit record levels in all regions apart from Greater London and North East England.
| Ave monthly room rent Q3 2026 | Ave monthly room rent Q3 2025 | Year-on-year rent change | |
|---|---|---|---|
| South West England | £689* | £673 | 2.3% |
| East Midlands | £576* | £566 | 1.8% |
| East Anglia | £687* | £679 | 1.2% |
| South East England | £709* | £701 | 1.2% |
| Yorkshire & the Humber | £569* | £564 | 1.0% |
| West Midlands | £594* | £590 | 0.6% |
| Greater London | £932 | £926 | 0.6% |
| North West England | £618* | £614 | 0.6% |
| North East England | £554 | £554 | -0.1% |
| Whole of UK | £769* | £762 | 1.0% |
*highest average room rent on record
England, Scotland and Northern Ireland rents at record highs
By country, the biggest year-on-year rent rise in Q3 was seen in Northern Ireland (+7%), as rent increases in Belfast (+6.8%) outpaced other UK cities. Rents are at record highs everywhere except Wales.
| Ave monthly room rent Q3 2026 | Ave monthly room rent Q3 2025 | Year-on-year rent change | |
| England | £775* | £768 | 1.0% |
| Scotland | £726* | £718 | 1.1% |
| Northern Ireland | £600* | £560 | 7.0% |
| Wales | £593 | £588 | 0.9% |
*highest average room rent on record
The chart below shows the trajectory of average room rents across the whole of the UK over the past decade:
London rent now into four figures
The average rent for inner London has surpassed £1K, and is now £1,002 per month, just shy of the record high of £1,003 set in Q4 2023. This is up 2.3% on the previous quarter, and up 1.1% year on year. Rent in outer London – now an average £800 per month – is holding steady (-0.2%).
Meanwhile, room rental supply fell 7.3% in inner London in the year to Q3 2026.
By postcode area, east London still has the lowest average room rent (£958 per month) and is seeing the smallest year-on-year rent increases too. By contrast, in south-west London, the average rent is now £1,065 per month and rising 2.4% year on year.
| Inner London postcode area | Ave monthly room rent Q3 2026 | Ave monthly room rent Q3 2025 | Year-on-year rent change | Year-on-year supply change |
|---|---|---|---|---|
| E | £958 | £954 | 0.4% | -6.5% |
| EC | £1,289 | £1,225 | 5.2% | -11.3% |
| N | £969* | £961 | 0.8% | -7.5% |
| NW | £999 | £988 | 1.1% | -7.3% |
| SE | £963* | £951 | 1.2% | -5.8% |
| SW | £1,065* | £1,039 | 2.4% | -10.0% |
| W | £1,064* | £1,050 | 1.3% | -4.6% |
| WC | £1,464* | £1,365 | 7.3% | -30.1% |
| Inner London | £1,002 | £990 | 1.1% | -7.3% |
| Outer London | £800 | £802* | -0.2% | -1.7% |
| Greater London (inner + outer) | £932 | £926 | 0.6% | -5.8% |
*indicates highest rent on record
Six inner London rents for sub-£800 pcm
The most expensive postcode in London is SW7, spanning South Kensington and Knightsbridge. The average monthly room rent (£1,682) there is more than double that of the cheapest postcode, E12 Manor Park, at £752 per month. But there are still six inner London postcodes with sub-£800 per month average rents:
| Postcode | Average monthly room rent Q3 2026 |
|---|---|
| E12 (Manor Park) | £729 |
| E6 (East Ham) | £755 |
| N21 (Winchmore Hill) | £761 |
| E7 (Forest Gate) | £781 |
| E13 (Plaistow) | £789 |
| N9 (Lower Edmonton) | £790 |
Belfast and Exeter top UK city rent rises
Of the largest top 30 cities by flatshare supply, Belfast (+6.8%) and Exeter (+4.5%) have seen the biggest year-on-year rent rises; Swansea (-3.6%) and Manchester (-2.1%) have seen the biggest falls; while the average rent for inner London has surpassed £1K.
The table below shows how rents have changed in the 30 UK cities with the highest levels of flatshare supply in Q3 2026. In Exeter, a shortage of on-campus accommodation saw demand for rooms in flatshares soar by a staggering 79% year on year – higher than any other city in the UK – pushing up rents by 4.5% on the previous year.
| City | Ave monthly room rent Q3 2026 | Ave monthly room rent Q3 2025 | Year-on-year rent change | |
|---|---|---|---|---|
| 1 | Belfast | £624 | £585 | 6.8% |
| 2 | Exeter | £681 | £651 | 4.5% |
| 3 | Derby | £594 | £577 | 2.9% |
| 4 | Edinburgh | £894 | £871 | 2.7% |
| 5 | Coventry | £571 | £556 | 2.7% |
| 6 | Colchester | £639 | £626 | 2.1% |
| 7 | Oxford | £834 | £818 | 2.0% |
| 8 | Norwich | £615 | £604 | 1.8% |
| 9 | Plymouth | £588 | £577 | 1.8% |
| 10 | Milton Keynes | £694 | £683 | 1.7% |
| 11 | Bristol | £746 | £734 | 1.7% |
| 12 | Liverpool | £554 | £546 | 1.6% |
| 13 | Nottingham | £588 | £580 | 1.5% |
| 14 | Sheffield | £540 | £533 | 1.2% |
| 15 | London (Inner) | £1,002 | £990 | 1.1% |
| 16 | Leicester | £574 | £568 | 1.1% |
| 17 | York | £750 | £744 | 0.8% |
| 18 | Southampton | £663 | £658 | 0.8% |
| 19 | Leeds | £578 | £574 | 0.7% |
| 20 | Newcastle-upon-Tyne | £604 | £601 | 0.4% |
| 21 | Cambridge | £792 | £790 | 0.4% |
| 22 | Glasgow | £692 | £692 | 0.0% |
| 23 | Peterborough | £593 | £596 | -0.6% |
| 24 | Lincoln | £515 | £520 | -1.0% |
| 25 | Brighton & Hove | £762 | £771 | -1.2% |
| 26 | Birmingham | £614 | £622 | -1.4% |
| 27 | Cardiff | £650 | £659 | -1.4% |
| 28 | Salford | £693 | £708 | -2.0% |
| 29 | Manchester | £685 | £699 | -2.1% |
| 30 | Swansea | £525 | £544 | -3.6% |
Methodology: In Q2 2026, SpareRoom launched its improved room rental index and an updated methodology. Historical data has been recalculated to ensure consistency across the series. The latest Q3 2026 data is based on more than 241,000 UK room ads (no whole properties). Rents are mean averages inclusive of bills and based on asking prices. Rents and percentage changes are based on unrounded values and rounded for display. Postcodes/towns/cities with a sample size of less than 25 were excluded. Rooms priced under £150pm are excluded. South East England excludes Greater London, unless specified otherwise.