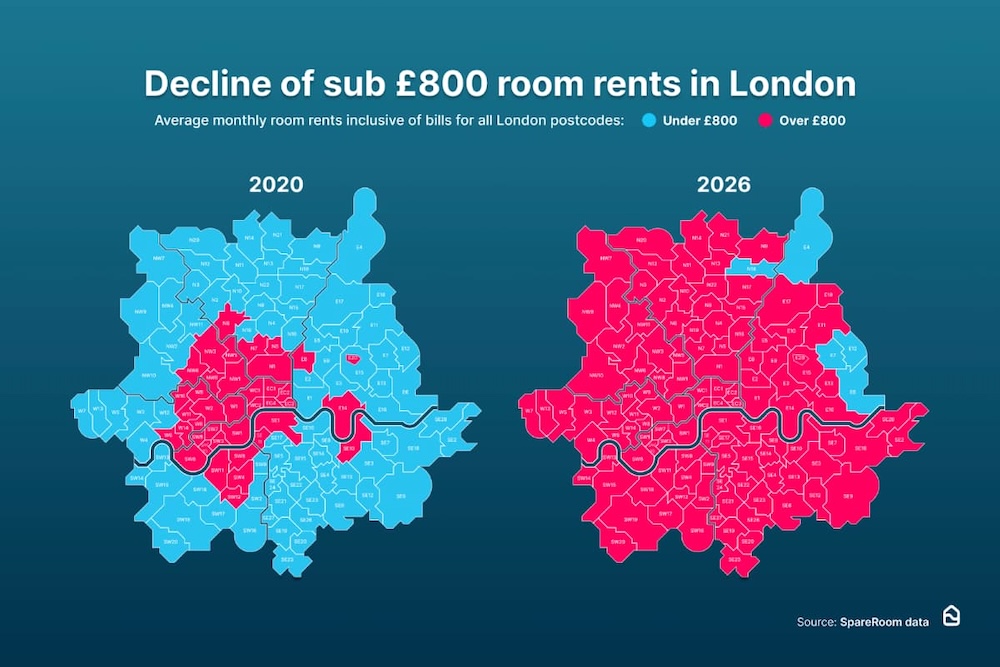
- Only five London postcodes still have sub-£800 average room rents, down from 81 postcodes in 2020.
- The average room rent for London is now £978 per month, down 0.5% on the previous year, but this doesn't reflect what's going on at postcode level.
- Outliers include W8 (Holland Park), NW7 (Mill Hill), SE4 (Brockley) and SE19 (Crystal Palace) which have seen the highest year-on-year rent rises in the capital.
- Demand for rooms in the capital has dropped 12% on the previous year as room supply has increased by 4.8%. Are priced-out renters falling out of love with London?
Only five London postcodes still have average room rents below £800 per month and all are in the E or N postcode areas, according to Q1 2026 rental index data from flatshare site SpareRoom.
Those looking for the cheapest rents should focus their searches on E6 (East Ham), E12 (Manor Park), E4 (Chingford), N18 (Upper Edmonton), and E7 (Forest Gate).
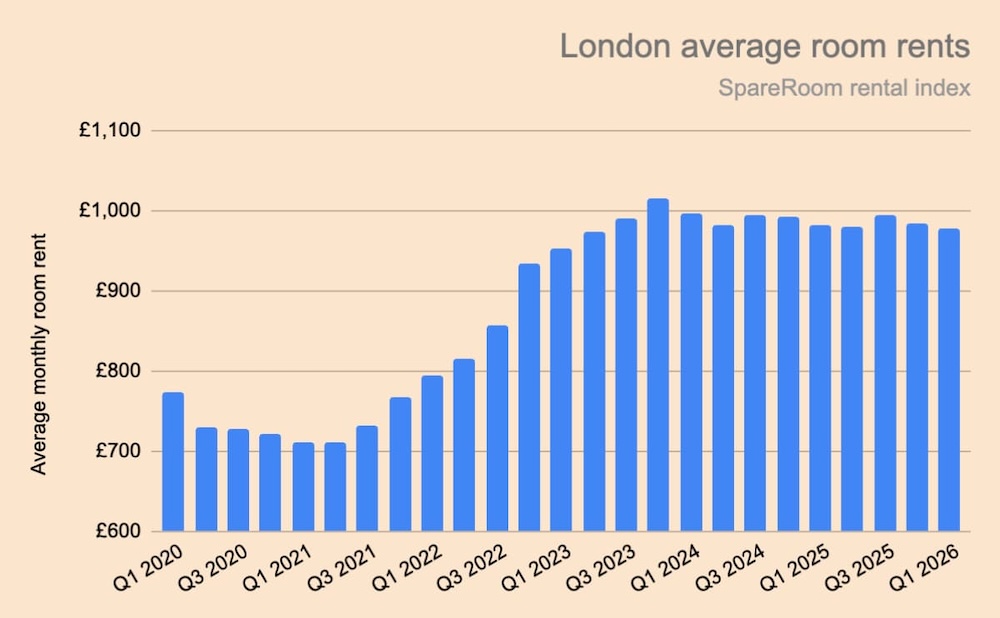
It was a different picture pre-pandemic, in Q1 2020, when London's average room rent was £773 per month and 81 London postcodes had sub-£800 room rents, including 50 below £700 per month.
The average room rent for London is now £978 per month. On the upside, this is down 0.5% on the previous year. Demand for rooms in the capital is down 12% year on year, as room supply has increased by 4.8%.
London room rents hit a record high of £1,015 per month more than two years ago, at the end of 2023. Despite marginal year-on-year decreases throughout 2025 and in the first quarter of 2026, rents in the capital are still way above the ceiling of affordability for many people, after years of upward pressure on rents caused by intense post-pandemic demand, as shown in the graph below:
This table shows how room rents have changed year on year in the eight inner London postcode areas:
| London regions | Average monthly room rent Q1 2026 | Average monthly room rent Q1 2025 | YOY change |
|---|---|---|---|
| E | £937 | £951 | -1.5% |
| EC | £1,228 | £1,204 | 2.0% |
| N | £941 | £946 | -0.5% |
| NW | £978 | £990 | -1.2% |
| SE | £948 | £945 | 0.3% |
| SW | £1,033 | £1,036 | -0.2% |
| W | £1,049 | £1,036 | 1.3% |
| WC | £1,257 | £1,296 | -3.0% |
| London (inner) | £978 | £983 | -0.5% |
| Whole of UK | £747 | £746 | 0.1% |
| UK (excluding inner London) | £668 | £665 | 0.5% |
This table shows the 10 most and least expensive postcode districts in London:
| Most expensive | Least expensive | ||
|---|---|---|---|
| Postcode | Average monthly room rent Q1 2026 | Postcode | Average monthly room rent Q1 2026 |
| SW7 (South Kensington/Knightsbridge) | £1,572 | E6 (East Ham) | £727 |
| W8 (Holland Park) | £1,528 | E12 (Manor Park) | £731 |
| EC2 (Bishopsgate/Cheapside) | £1,485 | E4 (Chingford) | £764 |
| W1 (West End/Soho) | £1,446 | N18 (Upper Edmonton) | £774 |
| SW3 (Chelsea) | £1,306 | E7 (Forest Gate) | £781 |
| SW5 (Earl's Court/West Brompton) | £1,294 | E10 (Leyton) | £803 |
| SW10 (West Brompton/Chelsea) | £1,276 | E13 (Plaistow) | £804 |
| SW1 (Westminster/Belgravia/Pimlico) | £1,252 | SE12 (Lee) | £804 |
| W2 (Bayswater/Paddington) | £1,249 | SE28 (Thamesmead) | £809 |
| WC1 (Bloomsbury/High Holborn) | £1,248 | N9 (Lower Edmonton) | £815 |
This table shows the 10 postcode districts where rents have risen most year on year. With the exception of W8, NW5 and E8, all these postcodes have below-average rents for London:
| Postcode | Average monthly room rent Q1 2026 | Average monthly room rent Q1 2025 | YOY change |
|---|---|---|---|
| W8 (Holland Park) | £1,528 | £1,394 | 10% |
| NW7 (Mill Hill) | £929 | £856 | 9% |
| SE4 (Brockley) | £904 | £841 | 7% |
| SE19 (Crystal Palace) | £872 | £816 | 7% |
| SE15 (Peckham) | £973 | £919 | 6% |
| NW5 (Kentish Town) | £1,067 | £1,008 | 6% |
| SW14 (Mortlake) | £873 | £825 | 6% |
| E8 (Dalston) | £1,128 | £1,070 | 5% |
| SE24 (Herne Hill) | £959 | £911 | 5% |
| N3 (Finchley) | £948 | £903 | 5% |
This table shows the 10 postcode districts where rents have fallen most year on year. With the exception of SW3, N5 and E20 all these postcodes have below-average rents for London:
| Postcode | Average monthly room rent Q1 2026 | Average monthly room rent Q1 2025 | YOY change |
|---|---|---|---|
| SW3 (Chelsea) | £1,306 | £1,485 | -12% |
| SE23 (Forest Hill) | £874 | £946 | -8% |
| N18 (Upper Edmonton) | £774 | £828 | -6% |
| E12 (Manor Park) | £731 | £781 | -6% |
| E6 (East Ham) | £727 | £772 | -6% |
| E10 (Leyton) | £803 | £851 | -6% |
| N5 (Highbury) | £1,019 | £1,072 | -5% |
| E20 (Olympic Park) | £1,210 | £1,270 | -5% |
| N10 (Muswell Hill) | £876 | £918 | -5% |
| NW10 (Willesden) | £893 | £933 | -4% |
Matt Hutchinson, director at flatshare site SpareRoom, comments: “Rents in the capital have been flatlining for a while. While this is clearly better than the years of uplifts that came before, it's hardly a dream scenario. Years of intense demand on London's limited rental stock has inflated prices and made cheap rents all too scarce. Falling demand and slightly increased supply points to more renters being priced out of inner London, which is why we're still seeing heightened demand in the suburbs and commuter belt.
“In reality, there's no such thing as cheap housing in London now. If you do manage to find a room at £800 per month - and these are increasingly endangered - you'd still need to be earning a salary of £32,000 a year to afford the rent. This is over and above what many people in the capital earn, especially those just starting their careers.”