
- South-east London postcodes dominate the highest rent risers list, led by huge year-on-year rent hikes in Crystal Palace and Forest Hill (+11.1%).
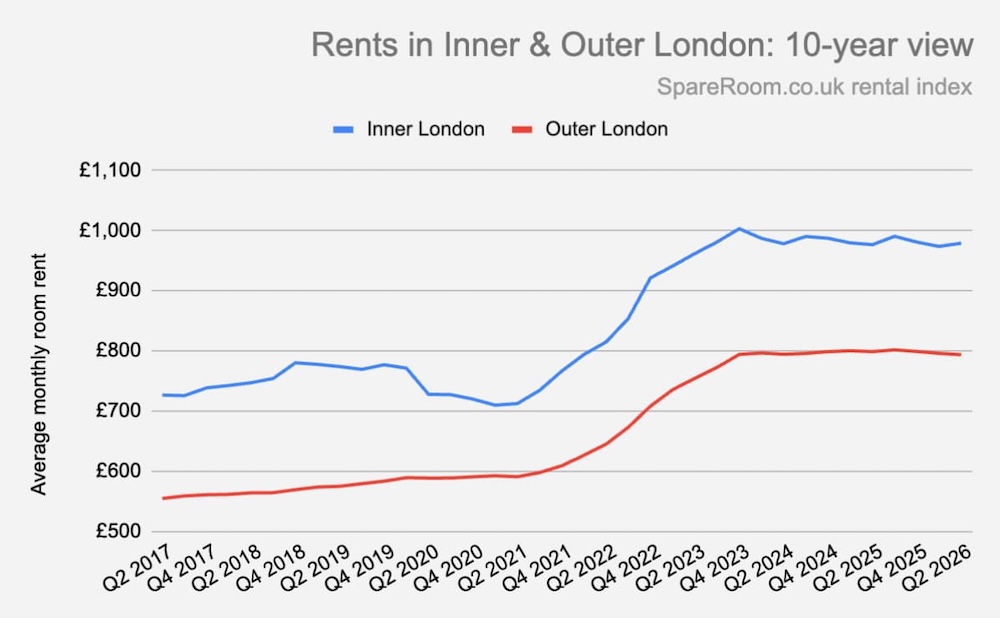
- The average room rent in inner London is now £979 per month, a marginal rise of 0.3% on the previous year. In outer London, rent is now £794 per month, down 0.6% YOY.
- Over the past five years, inner London rents have risen 37%; outer London rents are up 34%.
- Flatshare supply is falling in inner London (-5%) YOY, but holding steady in outer London (+0.9%).
- SpareRoom's improved rental index launches today with an updated methodology. Historical data has been recalculated for consistency.
Flatshare supply dropped by 5% in inner London in the second quarter of 2026 - during which phase one of the Renters' Right Act kicked in. But, so far, inner London rents are steady at £979 per month, only a small increase (+0.3%) on Q2 2025, according to rental index data from flatshare site SpareRoom.
In outer London, rents fell slightly (-0.6%) in the year to Q2 2026, as supply rose marginally (+0.9%). Renting an average room in outer London is now £794 per month.
But there are outliers, notably eight south-east London postcodes that dominate the list of 10 highest risers for rent in Q2. Huge year-on-year rent increases in Crystal Palace and Forest Hill (+11.1%) have taken the average rent in both postcodes to above £900 per month while pricier West Norwood and Herne Hill have seen +8.6% and +7.5% hikes respectively.
East and north London are the most affordable areas in the capital, with average rents of £933 and £937 per month respectively.
Renters seeking affordability could also look at Muswell Hill (£884) in north London and Norwood (£804) in south-east London, where room rents have seen the highest year-on-year falls (-11.4% and -7.2% respectively) and where rents are below-average for inner London. Or else the eight inner London postcodes with sub-£800-per-month rents, which include Penge (£796) and Winchmore Hill (£797).
The chart below shows average room rents in inner and outer London over the past decade:
This table shows how room rents have changed year on year, and over the past five years, in the eight inner London postcode areas and across the capital:
| London area | Ave monthly room rent Q2 2026 | Ave monthly room rent Q2 2025 | Ave monthly room rent Q2 2021 | Year-on-year change | Five-year change |
|---|---|---|---|---|---|
| E | £933 | £940 | £679 | -0.7% | 37.4% |
| EC | £1,281 | £1,213 | £826 | 5.6% | 55.1% |
| N | £937 | £944 | £683 | -0.7% | 37.2% |
| NW | £977 | £980 | £714 | -0.4% | 36.7% |
| SE | £961 | £952 | £692 | 1.0% | 39.0% |
| SW | £1,039 | £1,021 | £753 | 1.7% | 37.8% |
| W | £1,043 | £1,027 | £755 | 1.6% | 38.2% |
| WC | £1,313 | £1,297 | £880 | 1.2% | 49.2% |
| Inner London | £979 | £977 | £712 | 0.3% | 37.4% |
| Outer London | £794 | £799 | £591 | -0.6% | 34.4% |
| Greater London (inner + outer) | £915 | £917 | £685 | -0.2% | 33.6% |
This table shows the 10 most and least expensive postcode districts in inner London:
| Most expensive | Least expensive | ||
|---|---|---|---|
| Postcode | Average monthly room rent Q2 2026 | Postcode | Average monthly room rent Q2 2026 |
| SW7 (South Ken, Knightsbridge) | £1,599 | E12 (Manor Park) | £729 |
| W1 (West End) | £1,471 | E6 (East Ham) | £734 |
| W8 (Holland Park) | £1,449 | E7 (Forest Gate) | £778 |
| SW3 (Chelsea) | £1,360 | N18 (Upper Edmonton) | £789 |
| SW1 (Westminster, Victoria) | £1,284 | N9 (Lower Edmonton) | £789 |
| SW10 (West Brompton, Chelsea) | £1,282 | E4 (Chingford) | £792 |
| WC1 (Bloomsbury, High Holborn) | £1,274 | SE20 (Penge) | £796 |
| SW5 (Earl's Court, West Brompton) | £1,273 | N21 (Winchmore Hill) | £797 |
| EC1 (Aldersgate, Finsbury, Holborn) | £1,267 | E13 (Plaistow) | £800 |
| NW1 (Regent's Park, St Pancras) | £1,217 | SE25 (Norwood) | £804 |
This table shows the 10 inner London postcode districts where rents have risen most year on year:
| Postcode | Average monthly room rent Q2 2026 | Average monthly room rent Q2 2025 | Year-on-year change |
|---|---|---|---|
| SE19 (Crystal Palace) | £901 | £811 | 11.1% |
| SE23 (Forest Hill) | £913 | £822 | 11.1% |
| SE27 (West Norwood) | £975 | £898 | 8.6% |
| SE24 (Herne Hill) | £984 | £915 | 7.5% |
| SE18 (Plumstead) | £872 | £813 | 7.3% |
| SE28 (Thamesmead) | £844 | £791 | 6.7% |
| SE22 (Dulwich) | £969 | £910 | 6.5% |
| SW10 (West Brompton, Chelsea) | £1,282 | £1,205 | 6.4% |
| SE17 (Walworth) | £1,104 | £1,038 | 6.4% |
| W6 (Hammersmith) | £1,094 | £1,029 | 6.3% |
This table shows the 10 inner London postcode districts where rents have fallen most year on year:
| Postcode | Average monthly room rent Q2 2026 | Average monthly room rent Q2 2025 | Year-on-year change |
|---|---|---|---|
| N10 (Muswell Hill) | £884 | £998 | -11.4% |
| SE25 (Norwood) | £804 | £866 | -7.2% |
| E12 (Manor Park) | £729 | £781 | -6.7% |
| NW5 (Kentish Town) | £1,038 | £1,112 | -6.7% |
| N13 (Palmers Green) | £811 | £859 | -5.6% |
| N19 (Upper Holloway) | £935 | £987 | -5.3% |
| N5 (Highbury) | £1,006 | £1,054 | -4.6% |
| N20 (Whetstone) | £862 | £901 | -4.3% |
| N18 (Upper Edmonton) | £789 | £823 | -4.1% |
| E7 (Forest Gate) | £778 | £810 | -4.0% |
Matt Hutchinson, director at flatshare site SpareRoom, comments: “Crystal Palace and Forest Hill were once seen as 'good value alternatives' to places like Clapham or East Dulwich. Today, they're highly desirable in their own right, with plenty of green space, the Windrush line and rail connections, bags of character, and rents below the inner London average. In the knowledge that sky-high housing and living costs might mean they're sharing for years to come, flatsharers today are increasingly concerned about quality of life as well as affordability, and they're moving wherever can offer them the best of both, pushing up rents in the process.”