
- East Anglia has seen the highest three-year rise in room rents (+9.9%) followed by SE England (+9.5%) and SW England (+9.4%) which has also seen the highest year-on-year increase (+1.6%).
- By country, rents hit record highs in both Wales and Northern Ireland. In the three years to Q2 2026, rents have risen 12% in Northern Ireland, and are up 3.8% year on year, with a record high seen in Belfast in Q2 (£600 per month). Rents in Wales have risen 9.3% in three years.
- Flatshare room supply in Q2 2026 - the same quarter the Renter's Right Act's main reforms kicked in - fell (-3.2%) on the previous year, ending a run of three years of growth.
- SpareRoom's improved rental index launches today with an updated methodology. Historical data has been recalculated for consistency.
As phase one of the Renter's Right Act came into effect (from 1 May), rental index data from flatshare site SpareRoom for the second quarter of 2026 shows record rent highs in six of the UK's nine regions.
Meanwhile, flatshare supply has reversed course and started falling. Room ads decreased by 3.2% in the year to Q2, ending a three-year growth run, as shown the table below:
| Quarter | YOY change UK room rental supply |
|---|---|
| Q2 2026 | -3.2% |
| Q2 2025 | +8.7% |
| Q2 2024 | +24.2% |
| Q2 2023 | +15.0% |
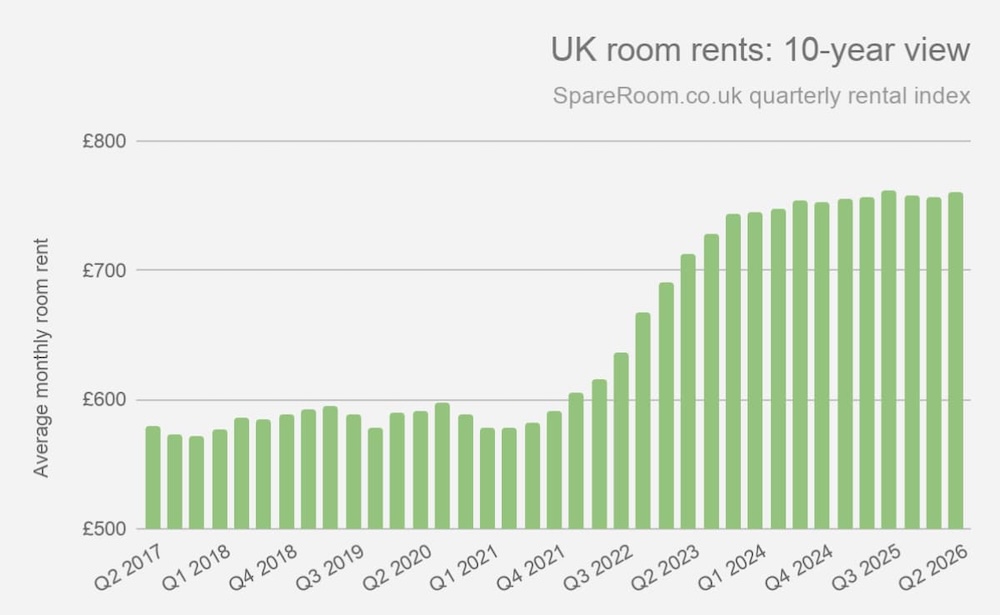
Renting a room in the UK now costs £761 per month on average, a 0.5% increase on the previous year. Across the UK, rents have risen almost 7% in the past three years.
Regionally, the largest year-on-year rent rise has been in South West England (+1.6%) but, comparing Q2 2026 with Q2 2023, it's East Anglia that's seen the biggest three-year increase; rents here are up 9.9%.
Greater London is the only region that has seen a year-on-year rent fall: room rents in the capital are down 0.2%.
The table below shows rents by region, with record highs for Q2 2026 shaded:
| Ave monthly room rent Q2 2026 | Ave monthly room rent Q2 2025 | Ave monthly room rent Q2 2023 | 1-year change | 3-year change | |
|---|---|---|---|---|---|
| East Anglia | £684 | £674 | £622 | 1.5% | 9.9% |
| East Midlands | £568 | £565 | £543 | 0.5% | 4.6% |
| Greater London | £915 | £917 | £899 | -0.2% | 1.8% |
| North East England | £552 | £552 | £519 | 0.0% | 6.3% |
| North West England | £614 | £607 | £565 | 1.2% | 8.6% |
| South East England | £703 | £693 | £642 | 1.5% | 9.5% |
| South West England | £678 | £668 | £620 | 1.6% | 9.4% |
| West Midlands | £587 | £581 | £552 | 0.9% | 6.3% |
| Yorkshire & Humber | £569 | £568 | £541 | 0.1% | 5.1% |
| Whole of UK | £761 | £757 | £713 | 0.5% | 6.7% |
The table below shows rents by country, with record highs for Q2 2026 shaded:
| Country | Ave monthly room rent Q2 2026 | Ave monthly room rent Q2 2025 | Ave monthly room rent Q2 2023 | 1-year change | 3-year change |
|---|---|---|---|---|---|
| England | £767 | £763 | £720 | 0.5% | 6.4% |
| Northern Ireland | £580 | £559 | £518 | 3.8% | 12.0% |
| Scotland | £698 | £691 | £641 | 1.1% | 8.9% |
| Wales | £594 | £588 | £543 | 1.0% | 9.3% |
The chart below shows the trajectory of UK room rents over the past decade:
The table below how rents have changed year on year in the 30 UK cities with the highest levels of flatshare supply in Q2 2026.
Norwich has seen the highest increase in room rents (+5.1%) while Lincoln has seen the biggest decrease (-4%). London (£979), Edinburgh (£834) and Oxford (£814) have the most expensive room rents while Lincoln (£510), Swansea (£532) and Sheffield (£533) have the cheapest.
However, Sheffield rents in Q2 (£533) matched the record high set in Q3 2025, and are rising 1.3% year on year. Rents in Liverpool hit a record high in Q2 (£556) and rents are rising 4.3% year on year.
| City | Ave monthly room rent Q2 2026 | Ave monthly room rent Q2 2025 | Year-on-year rent change | |
|---|---|---|---|---|
| 1 | Norwich | £619 | £589 | 5.1% |
| 2 | Exeter | £672 | £641 | 4.8% |
| 3 | Liverpool | £556 | £533 | 4.3% |
| 4 | Coventry | £565 | £542 | 4.2% |
| 5 | Colchester | £634 | £622 | 1.9% |
| 6 | Milton Keynes | £686 | £674 | 1.8% |
| 7 | Sheffield | £533 | £526 | 1.3% |
| 8 | Edinburgh | £834 | £824 | 1.2% |
| 9 | Cambridge | £796 | £789 | 0.9% |
| 10 | Southampton | £662 | £657 | 0.8% |
| 11 | Salford | £701 | £697 | 0.6% |
| 12 | Oxford | £814 | £810 | 0.5% |
| 13 | Birmingham | £612 | £609 | 0.5% |
| 14 | Plymouth | £589 | £587 | 0.3% |
| 15 | Cardiff | £647 | £645 | 0.3% |
| 16 | London (Inner) | £979 | £977 | 0.2% |
| 17 | Nottingham | £584 | £583 | 0.2% |
| 18 | Bristol | £730 | £730 | 0.0% |
| 19 | Peterborough | £585 | £587 | -0.3% |
| 20 | Glasgow | £676 | £679 | -0.4% |
| 21 | Manchester | £680 | £684 | -0.6% |
| 22 | York | £744 | £749 | -0.7% |
| 23 | Derby | £581 | £585 | -0.7% |
| 24 | Brighton & Hove | £742 | £750 | -1.1% |
| 25 | Portsmouth | £646 | £654 | -1.2% |
| 26 | Leeds | £572 | £580 | -1.4% |
| 27 | Newcastle-upon-Tyne | £594 | £604 | -1.7% |
| 28 | Leicester | £561 | £571 | -1.8% |
| 29 | Swansea | £532 | £548 | -2.9% |
| 30 | Lincoln | £510 | £531 | -4.0% |
Matt Hutchinson, director at flatshare site SpareRoom, comments: “Rising rents across the country have to be addressed. The Renters' Rights Act will improve standards, but it's only half the job. The next, crucial, step is to tackle affordability. You can't solve the housing crisis through regulation alone. Unless real action is taken to protect and expand rental supply, tenants will continue to face higher rents, shrinking choice, and even greater pressure in what is an already-stretched market. Flatsharing is the cheapest way to rent but the data shows it's far from immune to market pressures.”